How much time I spend...
I was just thinking about the division of time amongst the various things I work on - and realized it's pretty bizarre. Unlike most grad students, I have to interface with people using my software for many different analysis types - some of which are "production" quality. That has it's own challenges, but I'll leave that for another day.
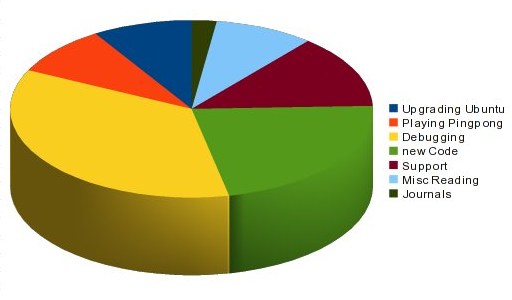
I figured I could probably recreate my average week in a pie chart form, covering the work I've been doing...

Honestly, though, It's just an estimate - and the sum is actually more than 40 hours a week. (I do work in the evenings, sometimes - and support for FindPeaks happens when I check my email in the evening, too. - to compensate, I may have been stingy on the hours spend goofing off....)
Anyhow, I think it would be an interesting project to try to keep track of how I spend my time. Maybe I'll give it a try when I come back from vacation. (Yes, I'll be away next week.)
Still, even from this estimate, three things are very clear:
I figured I could probably recreate my average week in a pie chart form, covering the work I've been doing...

Honestly, though, It's just an estimate - and the sum is actually more than 40 hours a week. (I do work in the evenings, sometimes - and support for FindPeaks happens when I check my email in the evening, too. - to compensate, I may have been stingy on the hours spend goofing off....)
Anyhow, I think it would be an interesting project to try to keep track of how I spend my time. Maybe I'll give it a try when I come back from vacation. (Yes, I'll be away next week.)
Still, even from this estimate, three things are very clear:
- I need to spend more time upfront writing tests for my software to cut down on debugging
- I need to spend more time reading journals.
- I am clearly underestimating the time I spend playing Ping Pong. But hey, I work through lunch!
Labels: General Musings, Grad School, time management

2 Comments:
Was a pie chart not bad enough?
http://blog.revolution-computing.com/2009/08/how-pie-charts-fail.html
a 3D pie chart!
stop it you're killing SNPs or kittens or something.
Man, if only I could kill a few snps....
and yes, pie charts are the fail, but in this case, it fit perfectly. The "error bars" (error wedges?) on the pie sections are easily wider than the slices, so it all cancels out and makes my point. (=
Post a Comment
<< Home