Thanks for visiting my blog - I have now moved to a new location at Nature Networks. Url: http://blogs.nature.com/fejes - Please come visit my blog there.

Thursday, December 17, 2009

One lane is (still) not enough...

After my quick post yesterday where I said one lane isn't enough, I was asked to elaborate a bit more, if I could. Well, I don't want do get into the details of the experiment itself, but I'm happy to jump into the "controls" a bit more in depth.

What I can tell is that with one lane of RNA-Seq (Illumina data50bp), all of the variations I find show up either in known polymorphism database or as somatic SNPs, with a few exceptions. The few exceptions just turn out to be exceptions for lack of coverage.

For a "control", I took two data sets (from two separate patients) - each with 6 individual lanes of sequencing data. (I realize this isn't the most robust experiment, but it shows a point.) In the perfect world, each of the 6 lanes per person would have sampled the original library equally well.

So, I matched up one lane from each patient into 6 sets and asked the question: How many transcripts are void (less than 5 tags) in one sample and at least 5x greater in the other sample. (I did this in both directions.)

The results aren't great. In one direction, I see an average of 1245 Transcripts (about 680 genes, so there's some overlap amongst the transcript set) with a std dev. of 38 Transcripts. That sounds pretty consistent, till you look for the overlap in actual transcripts: avg 27.3 with a std dev of 17.4. (range 0-60). And, when with do the calculations, the most closely matched data sets only have a 5% overlap.

The results for the opposite direction were similar: Average of 277 transcripts found that met the criteria (std.dev of 33.61), with an average overlap between data sets being 4.8, std. dev 4.48. (range of 0-11 transcripts in common.) The best overlap in "upregulated" genes for this dataset was just over 4% concordance with a second pair of lanes.

So, what this tells me (for a VERY dirty experiment) is that expression of genes in one lane is highly variable depending on the lane for genes expressed at the low end. (Sampling at the high end usually pretty good, so I'm not too concerned about that.)

What I haven't answered yet is how many lanes is enough. Alas, I have to go do some volunteering, so that experiment will have to wait for another day. And, of course, the images I created along the way will have to follow later as well.

Labels: , , , ,

Friday, November 6, 2009

ChIP-Seq normalization.

I've spent a lot of time working on ChIP-Seq controls recently, and wanted to raise an interesting point that I haven't seen addressed much: How to normalize well. (I don't claim to have read ALL of the chip-seq literature, and someone may have already beaten me to the punch... but I'm not aware of anything published on this yet.)

The question of normalization occurs as soon as you raise the issue of controls or comparing any two samples. You have to take it in to account when doing any type of comparision, really, so it's somewhat important as the backbone to any good second-gen work.

The most common thing I've heard to date is to simply normalize by the number of tags in each data set. As far as I'm concerned, that really will only work when your data sets come from the same library, or two highly correlated samples - when nearly all of your tags come from the same locations.

However, this method fails as soon as you move into doing a null control.

Imagine you have two samples, one is your null control, with the "background" sequences in it. When you seqeunce, you get ~6M tags, all of which represent noise. The other is ChIP-Seq, so some background plus an enriched signal. When you sequence, hopefully you sequence 90% of your signal, and 10% of the background to get ~8M tags - of which ~.8M are noise. When you do a compare, the number of tags isn't quite doing justice to the relationship between the two samples.

So what's the real answer? Actually, I'm not sure - but I've come up with two different methods of doing controls in FindPeaks: One where you normalize by identifying a (symmetrical) linear regression through points that are found in both samples, the other by identifying the points that appear in both samples and summing up their peak heights. Oddly enough, they both work well, but in different scenarios. And clearly, both appear (so far) to work better than just assuming the number of tags is a good normalization ratio.

More interesting, yet, is that the normalization seems to change dramatically between chromosomes (as does the number of mapping reads), which leads you to ask why that might be. Unfortunately, I'm really not sure why it is. Why should one chromosome be over-represented in an "input dna" control?

Either way, I don't think any of us are getting to the bottom of the rabbit hole of doing comparisons or good controls yet. On the bright side, however, we've come a LONG way from just assuming peak heights should fall into a nice Poisson distribution!

Labels: , , , ,

Wednesday, November 4, 2009

New ChIP-seq control

Ok, so I've finally implemented and debugged a second type of control in FindPeaks... It's different, and it seems to be more sensitive, requiring less assumptions to be made about the data set itself.

What it needs, now, is some testing. Is anyone out there willing to try a novel form of control on a dataset that they have? (I won't promise it's flawless, but hey, it's open source, and I'm willing to bug fix anything people find.)

If you do, let me know, and I'll tell you how to activate it. Let the testing begin!

Labels: , , , , ,

Monday, October 5, 2009

Why peak calling is painful.

In discussing my work, I'm often asked how hard it is to write a peak calling algorithm. The answer usually surprises people: It's trivial. Peak calling itself isn't hard. However, there are plenty of pitfalls that can surprise the unwary. (I've found myself in a few holes along the way, which have been somewhat challenging to get out of.)

The pitfalls, when they do show up, can be very painful - masking the triviality of the situation.

In reality, the three most frustrating things that occur in peak calling:
  1. Maintaining the software

  2. Peak calling without unlimited resources eg, 64Gb RAM

  3. Keeping on the cutting edge

On the whole, each of these things is a separate software design issue worthy of a couple of seconds of discussion.

When it comes to building software, it's really easy to fire up a "one-off" script. Anyone can write something that can be tossed aside when they're done with it - but code re-use and recycling is a skill. (And an important one.) Writing your peak finder to be modular is a lot of work, and a huge amount of time investment is required to keep the modules in good shape as the code grows. A good example of why this is important can be illustrated with file formats. Since the first version of FindPeaks, we've transitioned through two versions of Eland output, Maq's .map format and now on to SAM and BAM (but not excluding BED, GFF, and several other more or less obscure formats). In each case, we've been able to simply write a new iterator and plug it into the existing modular infrastructure. In fact, SAM support was added in quite rapidly by Tim with only a few hours of investment. That wouldn't have been possible without the massive upfront investment in good modularity.

The second pitfall is memory consumption - and this is somewhat more technical. When dealing with sequencing reads, you're faced with a couple of choices: you either sort the reads and then move along the reads one at a time, determining where they land - OR - you can pre-load all the reads, then move along the chromosome. The first model takes very little memory, but requires a significant amount of pre-processing, which I'll come back to in a moment. The second requires much less cpu time - but is intensely memory thirsty.

If you want to visualize this, the first method is to organize all of your reads by position, then to walk down the length of the chromosome with a moving window, only caring about the reads that fall into the window at any given point in time. This is how FindPeaks works now. The second is to build a model of the chromosome, much like a "pileup" file, which then can be processed however you like. (This is how I do SNP calling.) In theory, it shouldn't matter which one you do, as long as all your reads can be sorted correctly. The first can usually be run with a limited amount of memory, depending on the memory strucutures you use, whereas the second pretty much is determined by the size of the chromosomes you're using (multiplied by a constant that also depends on the structures you use.)

Unfortunately, using the first method isn't always as easy as you might expect. For instance, when doing alignments with transcriptomes (or indels), you often have gapped reads. An early solution to this in FindPeaks was to break each portion of the read into separate aligned reads, and process them individually - which works well when correctly sorted. Unfortunately, new formats no longer allow that - using a "pre-sorted" bam/sam file, you can now find multi-part reads, but there's no real option of pre-fragmenting those reads and re-sorting. Thus, FindPeaks now has an additional layer that must read ahead and buffer sam reads in order to make sure that the next one returned is the correct order. (You can get odd bugs, otherwise, and yes, there are many other potential solutions.)

Moving along to the last pitfall, the one thing that people want out of a peak finder is that it is able to do the latest and greatest methods - and do it ahead of everyone else. That on it's own is a near impossible task. To keep a peak finder relevant, you not only need to implement what everyone else is doing, but also do things that they're not. For a group of 30 people, that's probably not too hard, but for academic peak callers, that can be a challenge - particularly since every use wants something subtly different than the next.

So, when people ask how hard it is to write their own peak caller, that's the answer I give: It's trivial - but a lot of hard work. It's rewarding, educational and cool, but it's a lot of work.

Ok, so is everyone ready to write their own peak caller now? (-;

Labels: , , , , , , ,

Friday, October 2, 2009

Base quality by position

A colleague of mine was working on a nifty tool to give graphs of the base quality at each position in a read using Eland Export files, which could be incorporated into his pipeline. Over a discussion about the length of time it should take to do that analysis, (His script was taking an hour, and I said it should take about a minute to analyze 8M illumina reads...) I ended up saying I'd write my own version to do the analysis, just to show how quickly it could be done.

Well, I was wrong about it taking about a minute. It turns out that the file has a lot more than about double the originally quoted 8 million reads (QC, no match and multi match reads were not previously filtered), and the whole file was bzipped, which adds to the processing time.

Fortunately, I didn't have to add bzip support in to the reader, as tcezard (Tim) had already added in a cool "PIPE" option for piping in whatever data format I want in to applications of the Vancouver Short Read Analysis Package, thus, I was able to do the following:
time bzcat /archive/solexa1_4/analysis2/HS1406/42E6FAAXX_7/42E6FAAXX_7_2_export.txt.bz2 | java6 src/projects/maq_utilities/QualityReport -input PIPE -output /projects/afejes/temp -aligner elandext

Quite a neat use of piping, really.

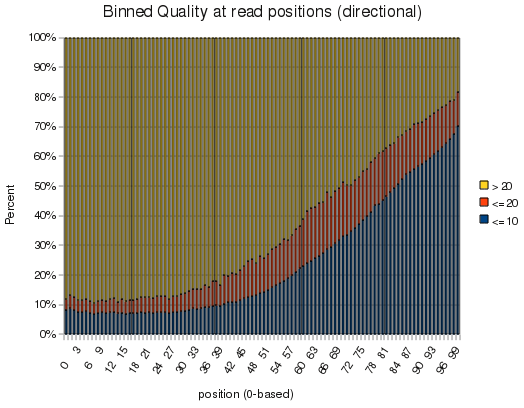
Anyhow, the fun part is that this was that the library was a 100-mer illumina run, and it makes a pretty picture. Slapping the output into openoffice yields the following graph:


I didn't realize quality dropped so dramatically at 100bp - although I remember when qualities looked like that for 32bp reads...

Anyhow, I'll include this tool in Findpeaks 4.0.8 in case any one is interested in it. And for the record, this run took 10 minutes, of which about 4 were taken up by bzcat. Of the 16.7M reads in the file, only 1.5M were aligned, probably due to the poor quality out beyond 60-70bp.

Labels: , , , , ,

Monday, September 28, 2009

Recursive MC solution to a simple problem...

I'm trying to find balance between writing and experiments/coding. You can't do both at the same time without going nuts, in my humble opinion, so I've come up with the plan of alternating days. One day of FindPeaks work, one day on my project. At that rate, I may not give the fastest responses (yes, I have a few emails waiting), but it should keep me sane and help me graduate in a reasonable amount of time. (For those of you waiting, tomorrow is FindPeaks day.)

That left today to work on the paper I'm putting together. Unfortunately, working on the paper doesn't mean I don't have any coding to do. I had a nice simulation that I needed to run: given the data sets I have, what are the likely overlaps I would expect?

Of course, I hate solving a problem once - I'd rather solve the general case and then plug in the particulars.

Today's problem can be summed up as: "Given n data sets, each with i_n genes, what is the expected number of genes common to each possible overlap of 2 or more datasets?"

My solution, after thinking about the problem for a while, was to use a recursive solution. Not surprisingly, I haven't written recursive code in years, so I was a little hesitant to give it a shot. In contrast, I whipped up the code, and gave it a shot - and it worked the first time. (That's sometimes a rarity with my code - I'm a really good debugger, but can often be sloppy when writing code quickly the first time.) Best of all, the code is extensible - If I have more data sets later, I can just add them in and re-run. No code modification needed beyond changing the data. (Yes, I was sloppy and hard coded it, though it would be trivial to read it from a data file, if someone wants to re-use this code.)

Anyhow, it turned out to be an elegant solution to a rather complex problem - and I was happy to see that the results I have for the real experiment stick out like a sore thumb: it's far greater than random chance.

If anyone is interested in seeing the code, it was uploaded into the Vancouver Short Read Analysis Package svn repository: here. (I'm doubting the number of page views that'll get, but what the heck, it's open source anyhow.)
I love it when code works properly - and I love it even more when it works properly the first time.

All in all, I'd say it's been a good day, not even counting the 2 hours I spent at the fencing club. En gard! (-;

Labels: , ,

Tuesday, August 11, 2009

SNP/SNV callers minimum useful information

Ok, I sent a tweet about it, but it didn't solve the frustration I feel on the subject of SNP/SNV callers. There are so many of them out there that you'd think they grow on trees. (Actually, they grow on arrays...) I've written one, myself, and I know there are at least 3 others written at the GSC.

Anyhow, At first sight, what pisses me off is that there's no standard format. Frankly, that's not even the big problem, however. What's really underlying that problem is that there's no standard "minimum information" content being produced by the SNP/SNV callers. Many of them give a bare minimum information, but lack the details needed to really evaluate the information.

So, here's what I propose. If you're going to write a SNP or SNV caller, make sure your called variations contain the following fields:
  • chromosome: obviously the coordinate to find the location
  • position: the base position on the chromo
  • genome: the version of the genome against which the snp was called (eg. hg18 vs. hg19)
  • canonical: what you expect to see at that position. (Invaluable for error checking!)
  • observed: what you did see at that position
  • coverage: the depth at that position (filtered or otherwise)
  • canonical_obs: how many times you saw the canonical base (key to evaluating what's at that position
  • variation_obs: how many times you saw the variation
  • quality: give me something to work with here - a confidence value between 0 and 1 would be ideal... but lets pick something we compare across data sets. Giving me 9 values and asking me to figure something out is cheating. Sheesh!
Really, most of the callers out there give you most, if not all of it - but I have yet to see the final "quality" being given. The MAQ SNP caller (which is pretty good) asks you to look at several different fields and make up your own mind. That's fine for a first generation, but maybe I can convince people that we can do better in the second gen snp callers.

Ok, now I've got that off my chest! Phew.

Labels: , , , ,

Thursday, August 6, 2009

New Project Time... variation database

I don't know if anyone out there is interested in joining in - I'm starting to work on a database that will allow me to store all of the snps/variations that arise in any data set collected at the institution. (Or the subset to which I have the right to harvest snps, anyhow.) This will be part of the Vancouver Short Read Analysis Package, and, of course, will be available to anyone allowed to look at GPL code.

I'm currently on my first pass - consider it version 0.1 - but already have some basic functionality assembled. Currently, it uses a built in snp caller to identify locations with variations and to directly send them into a postgresql database, but I will shortly be building tools to allow SNPs from any snp caller to be migrated into the db.

Anyhow, just putting it out there - this could be a useful resource for people who are interested in meta analysis, and particularly those who might be interested in collaborating to build a better mousetrap. (=

Labels: , , , , , ,

Wednesday, July 29, 2009

Aligner tests

You know what I'd kill for? A simple set of tests for each aligner available. I have no idea why we didn't do this ages ago. I'm sick of off-by-one errors caused by all sorts of slightly different formats available - and I can't do unit tests without a good simple demonstration file for each aligner type.

I know Sam format should help with this - assuming everyone adopts it - but even for SAM I don't have a good control file.

I've asked someone here to set up this test using a known sequence- and if it works, I'll bundle the results into the Vancouver Package so everyone can use it.

Here's the 50-mer I picked to do the test. For those of you with some knowledge of cancer, it comes from tp53. It appears to blast uniquely to this location only.
>forward - chr17:7,519,148-7,519,197
CATGTGCTGTGACTGCTTGTAGATGGCCATGGCGCGGACGCGGGTGCCGG

>reverse - chr17:7,519,148-7,519,197
ccggcacccgcgtccgcgccatggccatctacaagcagtcacagcacatg

Labels: , , , , , ,

Monday, July 27, 2009

how recently was your sample sequenced?

One more blog for the day. I was postponing writing this one because it's been driving me nuts, and I thought I might be able to work around it... but clearly I can't.

With all the work I've put into the controls and compares in FindPeaks, I thought I was finally clear of the bugs and pains of working on the software itself - and I think I am. Unfortunately, what I didn't count on was that the data sets themselves may not be amenable to this analysis.

My control finally came off the sequencer a couple weeks ago, and I've been working with it for various analyses (snps and the like - it's a WTSS data set)... and I finally plugged it into my FindPeaks/FindFeatures pipeline. Unfortunately, while the analysis is good, the sample itself is looking pretty bad. In looking at the data sets, the only thing I can figure is that the year and a half of sequencing chemistry changes has made a big impact on the number of aligning reads and the quality of the reads obtained. I no longer get a linear correlation between the two libraries - it looks partly sigmoidal.

Unfortunately, there's nothing to do except re-seqeunce the sample. But really, I guess that makes sense. If you're doing a comparison between two data-sets, you need them to have as few differences as possible.

I just never realized that the time between samples also needed to be controlled. Now I have a new question when I review papers: How much time elapsed between the sequencing of your sample and it's control?

Labels: , , , , , ,

Friday, July 17, 2009

Community

This week has been a tremendous confluence of concepts and ideas around community. Not that I'd expect anyone else to notice, but it really kept building towards a common theme.

The first was just a community of co-workers. Last week, my lab went out to celebrate a lab-mate's successful defense of her thesis (Congrats, Dr. Sleumer!). During the second round of drinks (Undrinkable dirty martinis), several of us had a half hour conversation on the best way to desalinate an over-salty martini. As weird as it sounds, it was an interesting and fun conversation, which I just can't imagine having with too many people. (By the way, I think Obi's suggestion wins: distillation.) This is not a group of people you want to take for granted!

The second community related event was an invitation to move my blog over to a larger community of bloggers. While I've temporarily declined, it raised the question of what kind of community I have while I keep my blog on my own server. In some ways, it leaves me isolated, although it does provide a "distinct" source of information, easily distinguishable from other people's blogs. (One of the reasons for not moving the larger community is the lack of distinguishing marks - I don't want to sink into a "borg" experience with other bloggers and just become assimilated entirely.) Is it worth moving over to reduce the isolation and become part of a bigger community, even if it means losing some of my identity?

The third event was a talk I gave this morning. I spent a lot of time trying to put together a coherent presentation - and ended talking about my experiences without discussing the actual focus of my research. Instead, it was on the topic of "successes and failures in developing an open source community" as applied to the Vancouver Short Read Analysis Package. Yes, I'm happy there is a (small) community around it, but there is definitely room for improvement.

Anyhow, at the risk of babbling on too much, what I really wanted to say is that communities are all around us, and we have to seriously consider our impact on them, and the impact they have on us - not to mention how we integrate into them, both in our work and outside. If you can't maximize your ability to motivate them (or their ability to motivate you), then you're at a serious disadvantage. How we balance all of that is an open question, and one I'm still working hard at answering.

I've attached my presentation from this morning, just in case anyone is interested. (I've decorated it with pictures from the South Pacific, in case all of the plain text is too boring to keep you awake.)

Here it is (it's about 7Mb.)

Labels: , , , , , , , ,

Monday, June 8, 2009

Poster - reprise

In an earlier post, I said I'd eventually get around to putting up a thumbnail of the poster that I presented at the Canadian Institutes of Health Research National Research Poster Competition. (Yes, the word "research" appears twice in that sentence.) After a couple days of being busy with other stuff, I've finally gotten around to it.

I'm also happy to say that the poster was well received, despite the unconventional appearance. It was awarded an Award of Excellence (Silver category) from the judges.

thumbnail of poster

Labels: , ,

Friday, May 29, 2009

Science Cartoons - 3

I wasn't going to do more than one comic a day, but since I just published it into the FindPeaks 4.0 manual today, I may as well put it here too, and kill two birds with one stone.

Just to clarify, under copyright laws, you can certainly re-use my images for teaching purposes or your own private use (that's generally called "fair use" in the US, and copyright laws in most countries have similar exceptions), but you can't publish it, take credit for it, or profit from it without discussing it with me first. However, since people browse through my page all the time, I figure I should mention that I do hold copyright on the pictures, so don't steal them, ok?

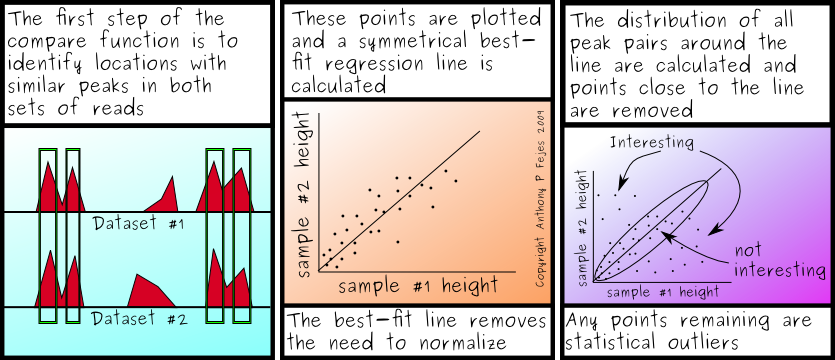
Anyhow, Comic #3 is a brief description of how the compare in FindPeaks 4.0 works. Enjoy!

Labels: , , , , , , , , ,

Monday, May 18, 2009

Questions about controls.

After my post on controls, the other day, I've discovered I'd left a few details out of my blog entry. It was especially easy to come to that conclusion, since it was pointed out by Aaron in a comment below.... Anyhow, since his questions were right on, I figured that they deserved a post of their own, not just a quick reply.

There were two parts to the questions, so I'll break up the reply into two parts. First:

One question - what exactly are you referring to as 'control' data? For chip-seq, sequencing the "input" ie non-enriched chromatin of your IPs makes sense, but does doubling the amount of sequencing you perform (therefore cost & analysis time) give enough of a return? eg in my first analysis we are using a normal and cancer cell line, and looking for differences between the two.
Control data, in the context I was using it, should be experiment specific. Non-enriched chromatin is probably going to be the most common for experiments with transcription factors, or possibly even histone modifications. Since you're most interested in the enrichment, a non-enriched control makes sense. At the GSC, we've had many conversations about what the appropriate controls are for any given experiment, and our answers have ranged from genomic DNA or non-enriched-DNA all the way to stimulated/unstimulated sample pairs. The underlying premise is that the control is always the one that makes sense for the given experiment.

On that note, I suspect it's probably worth rehashing the Robertson 2007 paper on stimulated vs. unstimulated IFN-gamma STAT1 transcription markers... hrm..

Anyhow, The second half of that question boils down to "is it really worth it to spend the money on controls?"

YES! Unequivocally YES!

Without a control, you'll never be able to get a good handle on the actual statistics behind your experiment, you'll never be able to remove bias in your samples (from the sequencing itself, and yes, it is very much present). In the tests I've been running on the latest FP code (3.3.3.1), I've been seeing what I think are incredibly promising results. If it cost 5 times as much to do controls, I'd still be pushing for them. (Of course, it's actually not my money, so take that for what it's worth.)

In any case, there's a good light at the end of the cost tunnel on this. Although yes, it does appear that the better the control, the better the results will be, we've also been able to "re-use" controls. So, in fact, having one good set of controls per species already seems to make a big contribution. Thus, controls should be amortizable over the life of the sequencing data, so the cost should not be anywhere near double for large sequencing centres. (I don't have hard data, to back this up, yet, but it is generally the experience I've had so far.)

To get to the second half of the question:

Also, what controls can you use for WTSS? Or do you just mean comparing two groups eg cancer vs normal?
That question is similar to the one above, and so is my answer: it depends on the question you're asking. If you want to use it to compare against another sample (eg, using FP 3.3.3.1's compare function), then you'll want to compare with another sample, which will be your "control". I've been working with this pipeline for a few weeks now and have been incredibly impressed with how well this works over my own (VERY old 32bp) data sets.

On the other hand, if you're actually interested in discovering new exons and new genes using this approach, you'd want to use a whole genome shotgun as your control.

As with all science, there's no single right answer for which protocol you need to use until you've decided what question you want to ask.

And finally, there's one last important part of this equation - have you sequenced either your control or your sample to enough depth? Even if you have controls working well, it's absolutely key to make sure your data can answer your question well. So many questions, so little time!

Labels: , ,

Friday, May 15, 2009

On the necessity of controls

I guess I've had this rant building up for a while, and it's finally time to write it up.

One of the fundamental pillars of science is the ability to isolate a specific action or event, and determine it's effects on a particular closed system. The scientific method actually demands that we do it - hypothesize, isolate, test and report in an unbiased manner.

Unfortunately, for some reason, the field of genomics has kind of dropped that idea entirely. At the GSC, we just didn't bother with controls for ChIP-Seq for a long time. I can't say I've even seen too many matched WTSS (RNA-SEQ) experiments for cancer/normals. And that scares me, to some extent.

With all the statistics work I've put in to the latest version of FindPeaks, I'm finally getting a good grasp of the importance of using controls well. With the other software I've seen, they do a scaled comparison to calculate a P-value. That is really only half of the story. It also comes down to normalization, to comparing peaks that are present in both sets... and to determining which peaks are truly valid. Without that, you may as well not be using a control.

Anyhow, that's what prompted me to write this. As I look over the results from the new FindPeaks (3.3.3.1), both for ChIP-Seq and WTSS, I'm amazed at how much clearer my answers are, and how much better they validate compared to the non-control based runs. Of course, the tests are still not all in - but what a huge difference it makes. Real control handling (not just normalization or whatever everyone else is doing) vs. Monte Carlo show results that aren't in the same league. The cutoffs are different, the false peak estimates are different, and the filtering is incredibly more accurate.

So, this week, as I look for insight in old transcription factor runs and old WTSS runs, I keep having to curse the lack of controls that exist for my own data sets. I've been pushing for a decent control for my WTSS lanes - and there is matched normal for one cell line - but it's still two months away from having the reads land on my desk... and I'm getting impatient.

Now that I'm able to find all of the interesting differences with statistical significance between two samples, I want to get on with it and find them, but it's so much more of a challenge without an appropriate control. Besides, who'd believe it when I write it up with all of the results relative to each other?

Anyhow, just to wrap this up, I'm going to make a suggestion: if you're still doing experiments without a control, and you want to get them published, it's going to get a LOT harder in the near future. After all, the scientific method has been pretty well accepted for a few hundred years, and genomics (despite some protests to the contrary) should never have felt exempt from it.

Labels: , , , , , , , ,

Tuesday, May 12, 2009

Quality vs Quantity

Today was an interesting day, for many reasons. The first was the afternoon tours for high-school students that came by the Genome Sciences Centre and the labs. I've been taking part in an outreach program for some of the students at two local high schools, which has involved visiting the students to teach them a bit of the biology and computers we do, as well as the tours that bring them by to see us "at work." Honestly, it's a lot of fun, and I really enjoy interacting with the kids. Their questions are always amusing and insightful - and are often a lot of fun to answer well. (How do you explain how the academic system works in 2 minutes or less?)

For my part, I introduced the kids to Pacific Biosystems SMRT technology. I came up with a relatively slick monologue that goes well with a video from PacBio. (If you haven't seen their video, you should definitely check this out.) The kids seem genuinely impressed with the concept, and really enjoy the graphics - although they enjoy the desktop effects with Ubuntu too... so maybe that's not the best criteria to use for evaluation.

Anyhow, aside from that distraction, I've also had the pleasure of working on some of my older code today. After months of people at the GSC ignoring the fact that I'd already written code to solve many of the problems they were trying to develop software, a few people have decided to pick up some of the pieces of the Vancouver Short Read Package and give it a test spin.

One of them was looking at FindFeatures - which I've used recently to find exons of interest in WTSS libraries - and the other was PSNPAnalysiPipeline code - which does some neat metrics for WTSS.

The fun part of it is that the code for both of those applications were written months ago - in some cases before I had the data to test them on. When revisiting them and now actually putting the code to use, I was really surprised by the number of options I'd tossed in, to account for many situations that hadn't even been seriously anticipated. Someone renamed all of your fasta files? No worries, just use the -prepend option! Your junction library has a completely non-standard naming? No problem, just use the -override_mapname option! Some of your MAQ aligned reads have indels - well, ok, i can give you a 1-line patch to make that work too.

I suppose that really makes me wonder: If I were writing one-off scripts, which would obviously lack this kind of flexibility, I'd be able to move faster and more nimble across the topics that interest me. (Several other grad students do that, and are well published because of it.) Is that a trade off I'm willing to make, though?

Someone really needs to hold a forum on this topic: "Grad students: quality or quantity?" I'd love to sit through those panel discussions. As for myself, I'm still somewhat undecided on the issue. I'd love more publications, but having the code just work (which gets harder and harder as the codebase hits 30k lines) is also a nice thing. While I'm sure users of my software are happy when these options exist, I wonder what my supervisor thinks of the months I've spent building all of these tools - and not writing papers.

Ah well, I suppose when it comes time to defend, I'll find out exactly what he thinks about that issue. :/

Labels: , , ,

Monday, May 11, 2009

FindPeaks 4.0

After much delay, and more statistics than I'd ever hoped to see in my entire life, I'm just about ready to tag FindPeaks 4.0.

There are some really cool things going on - better handling of control data, better compares, and even saturation analysis made it in. Overall, I'm really impressed with how well things are working on that front.

The one thing that I'm disappointed to have not been able to include was support for SAM/BAM files. No one is really pushing for it yet, here at the GSC, but it's only a matter of time. Unfortunately, the integration is not trivial, and I made the executive decision to work on other things first.

Still, I can't say I'm unhappy at all - there's room for a fresh publication, if we decide to go down that route. If not, I have at least 2 possible publications in the novel applications of the code for the biology. That can't be a bad thing.

Anyhow, I'm off to put a few final updates on the code before tagging the final 3.3.x release.

Labels: , ,

Friday, May 1, 2009

2 weeks of neglect on my blog = great thesis progress.

I wonder if my blogging output is inversely proportional to my progress on my thesis. I stopped writing two weeks ago for a little break, and ended up making big steps forward. The vast amount of my work went into FindPeaks, which included the following:

  • A complete threaded Saturation analysis for next-gen libraries.

  • A method of comparing next-gen libraries to identify peaks that are statistically significant outliers. (It's also symmetic, unlike a linear regression based methods.)

  • A better control method

  • A whole new way of analysing WTSS data, which gives statistically valid expression differences


And, of course many many other changes. Not everything is bug-free, yet, but it's getting there. All that's left on my task list are debugging a couple of things in the compare mode, relating to peaks present in only one of the two librarires, and an upgrade to my FDR cutoff prediction methods. Once those are done, I think I'll be ready to push out FindPeaks 4.0. YAY!

Actually, what was surprising to me was the sheer amount of work that I've done on this since January. I compiled the change list since my last "quarterly report" for a project that used FindPeaks (but doesn't support it, ironically.... why am I doing reports for them again?) and came up with 24 pages of commit messages - over 575 commits. Considering the amount of work I've done on my actual projects, away from FindPeaks, I think I've been pretty darn productive.

Yes, I'm going to take this opportunity to pat myself on the back in public for a whole 2 seconds... ok, done.

So, overall, blogging may not have been distracting me from my work, as even at the height of my blogging (around AGBT), I was still getting lots done, but the past two weeks have really been a help. I'll be back to blogging all the good stuff on monday. And I'm looking forward to doing some writing now, on some of the cool things in FP4.0 that haven't made it into the manual... yet.

Anyone want some fresh ChIP-Seq results? (-;

Labels: , , , ,

Monday, November 10, 2008

Bowtie and Single End Mapped Paired End Data

Strange title for a posting, but it actually makes sense, if you think about it.

One of the researchers here has been working on an assembly of a reasonably small fungal genome, using short read technology with which I've been somewhat involved. It's been an educational project for me, so I'm glad I had the opportunity to contribute. One of the key elements of the paper, however, was the use of Paired End Tags (PET) from an early Illumina machine to assess the quality of the assembly.

Unfortunately, an early run of the software I'd written to analyze the Maq alignments of the paired ends to the assemblies had a bug, which made it look like the data supported the theory quite nicely - but alas, it was just a bug. The bug was fixed a few weeks ago, and a re-run of the data turned up something interesting:

If you use Maq alignments, you're biasing your alignments towards the smith-waterman aligned sequences, which are not an independent measure of the quality of the assembly. Not shocking? I know - it's pretty obvious.

Unfortunately, we hadn't put it in context before hand, so we had to find another way of doing this. We wanted to get a fairly exhaustive set of alignments for each short read - and we wanted to get it quickly, so we turned to Bowtie. While I wasn't the one running the alignments, I have to admit, I'm impressed with the quick performance of the aligner. Multi-matches work well, the file format is intuitive - similar to an eland file, and the quality of the information seems to be good. (The lack of a good scoring mechanism is a problem, but wasn't vital for this project.)

Anyhow, by performing a Single End Tag style alignment on PET data, while retaining multimatches, we were able to remove the biases of the aligners, and perform the pairings ourselves - learning more about the underlying assembly to which we were aligning. This isn't something you'd want to do often, unless you're assembling genomes fairly regularly, but it's quite cool.

Alas, for the paper, I don't think this data was good enough quality - there may not be a good story in the results that will replace the one we thought we had when the data was first run... but there were other good results in the data, and the journey was worth the trip, even if the destination wasn't all we'd hoped it would be.

As a sidenote, my code was run on an otherwise unused 16-way box, and managed to get 1592% CPU usage, at one point, while taking up 46Gb of RAM. (I should have processed each lane of reads separately, but didn't.) That's the first time I've seen CPU usage that high on my code. My previous record was 1499%. I should note that I only observe these scalings during the input processing - so the overal speed up was only 4x.

The code is part of the Vancouver Short Read Analysis Package, called BowtieToBedFormat.java, if anyone needs a process similar to this for Bowtie Reads. (There's no manual for it at the moment, but I can put one togther, upon request.)

Labels: , , ,

Monday, November 3, 2008

Updates

It has been a VERY busy week since I last wrote. Mainly, that was due to my committee meeting on Friday, where I had to present my thesis proposal. I admit, there were a few things left hanging going into the presentation, but none of them will be hard to correct. As far as topics go for my comprehensive exams, it sounds like the majority of the work I need to do is to shore up my understanding of cancer. With a field that big, though, I have a lot of work to do.

Still, it was encouraging. There's a very good chance I could be wrapping up my PhD in 18-24 months. (=

Things have also been busy at home - we're still working on selling a condo in Vancouver, and had two showings and two open houses over the weekend, and considering the open houses were well attended,that is an encouraging sign.

FindPeaks has also had a busy weekend, even though I wasn't doing any coding, myself. A system upgrade took FindPeaks 3.1.9.2 off the web for a while and required a manual intervention to bring that back up. (Yay for the Systems Dept!) A bug was also found in all versions of 3.1 and 3.2, which could be fairly significant -and I'm still investigating. At this point, I've confirmed the bug, but haven't had a chance to identify if it's just for this one file, or for all files...

Several other findpeaks projects are also going to be coming to the forefront this week. Controls and automated file builds. Despite the bug I mentioned, FindPeaks would do well with an automated trunk build. More users would help me get more feedback, which would help me figure out what things people are using, so I can focus more on them. At least that's the idea. It might also recruit more developers, which would be a good thing.

And, of course, several new things that have appeared that I would like to get going on: Bowtie is the first one. If it does multiple alignments (as it claims to), I'll be giving it a whirl as the new basis of some of my work on transcriptomes. At a rough glance, the predicted 35x speedup compared to Maq is a nifty enticement for me. Then there's the opportunity to do some clean up code on the whole Vancouver package for command line parameter processing. A little work there could unify and clean up several thousand lines of code, and make new development Much easier.

First things first, though, I need to figure out the source and the effects of that bug in findpeaks!

Labels: , , ,

Thursday, October 9, 2008

Maq .map to .bed format converter

I've finally "finished" the manual for one section of the Vancouver Short Read Analysis Package - though it's not findpeaks. (I'm still working on that - but it's a big application.) It could still use pictures and graphs, and stuff... but it's now functional.
One down... about 7 more manuals to write. Documentation is never the fun stuff.

What slowed this down, ironically, was my inabilty to read the Maq documentation. I completely missed the fact that unmapped reads are now included in PET aligned .map files, but with a different paired flag status. Previously, unmapped ends were thrown away, and I had to handle the unpaired ends. With the new version, those unmapped reads are now included, but given a status of 192, so they can be paired again - albeit there's not much information in the pairing. Infact, I can even handle the other ends as I find them, because they're given a status of 64. (Do these numbers seem arbitrary to anyone other than me?)

Anyhow, Finally, the .map to .bed converter works - and there's a manual to go with it.

Cheers.

Labels: ,